


The Orders Reports section in EasyCommerce gives you a clear picture of how your store is performing over time. It brings together order data, revenue, customer behavior and fulfillment insights in one place so you can quickly understand what’s going on without digging through individual orders.
Accessing Orders Reports
To view the Orders Reports in EasyCommerce please go to:
WordPress Dashboard → EasyCommerce → Reports → Orders
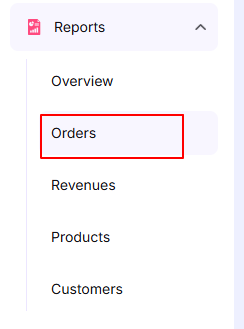
This will open the Orders Reports page where you can see a full overview of your store’s order activity. From here you will be able to track total orders, completed and pending orders, refunds, net revenue, customer behavior and other important insights all in one place for quick monitoring and decision-making.
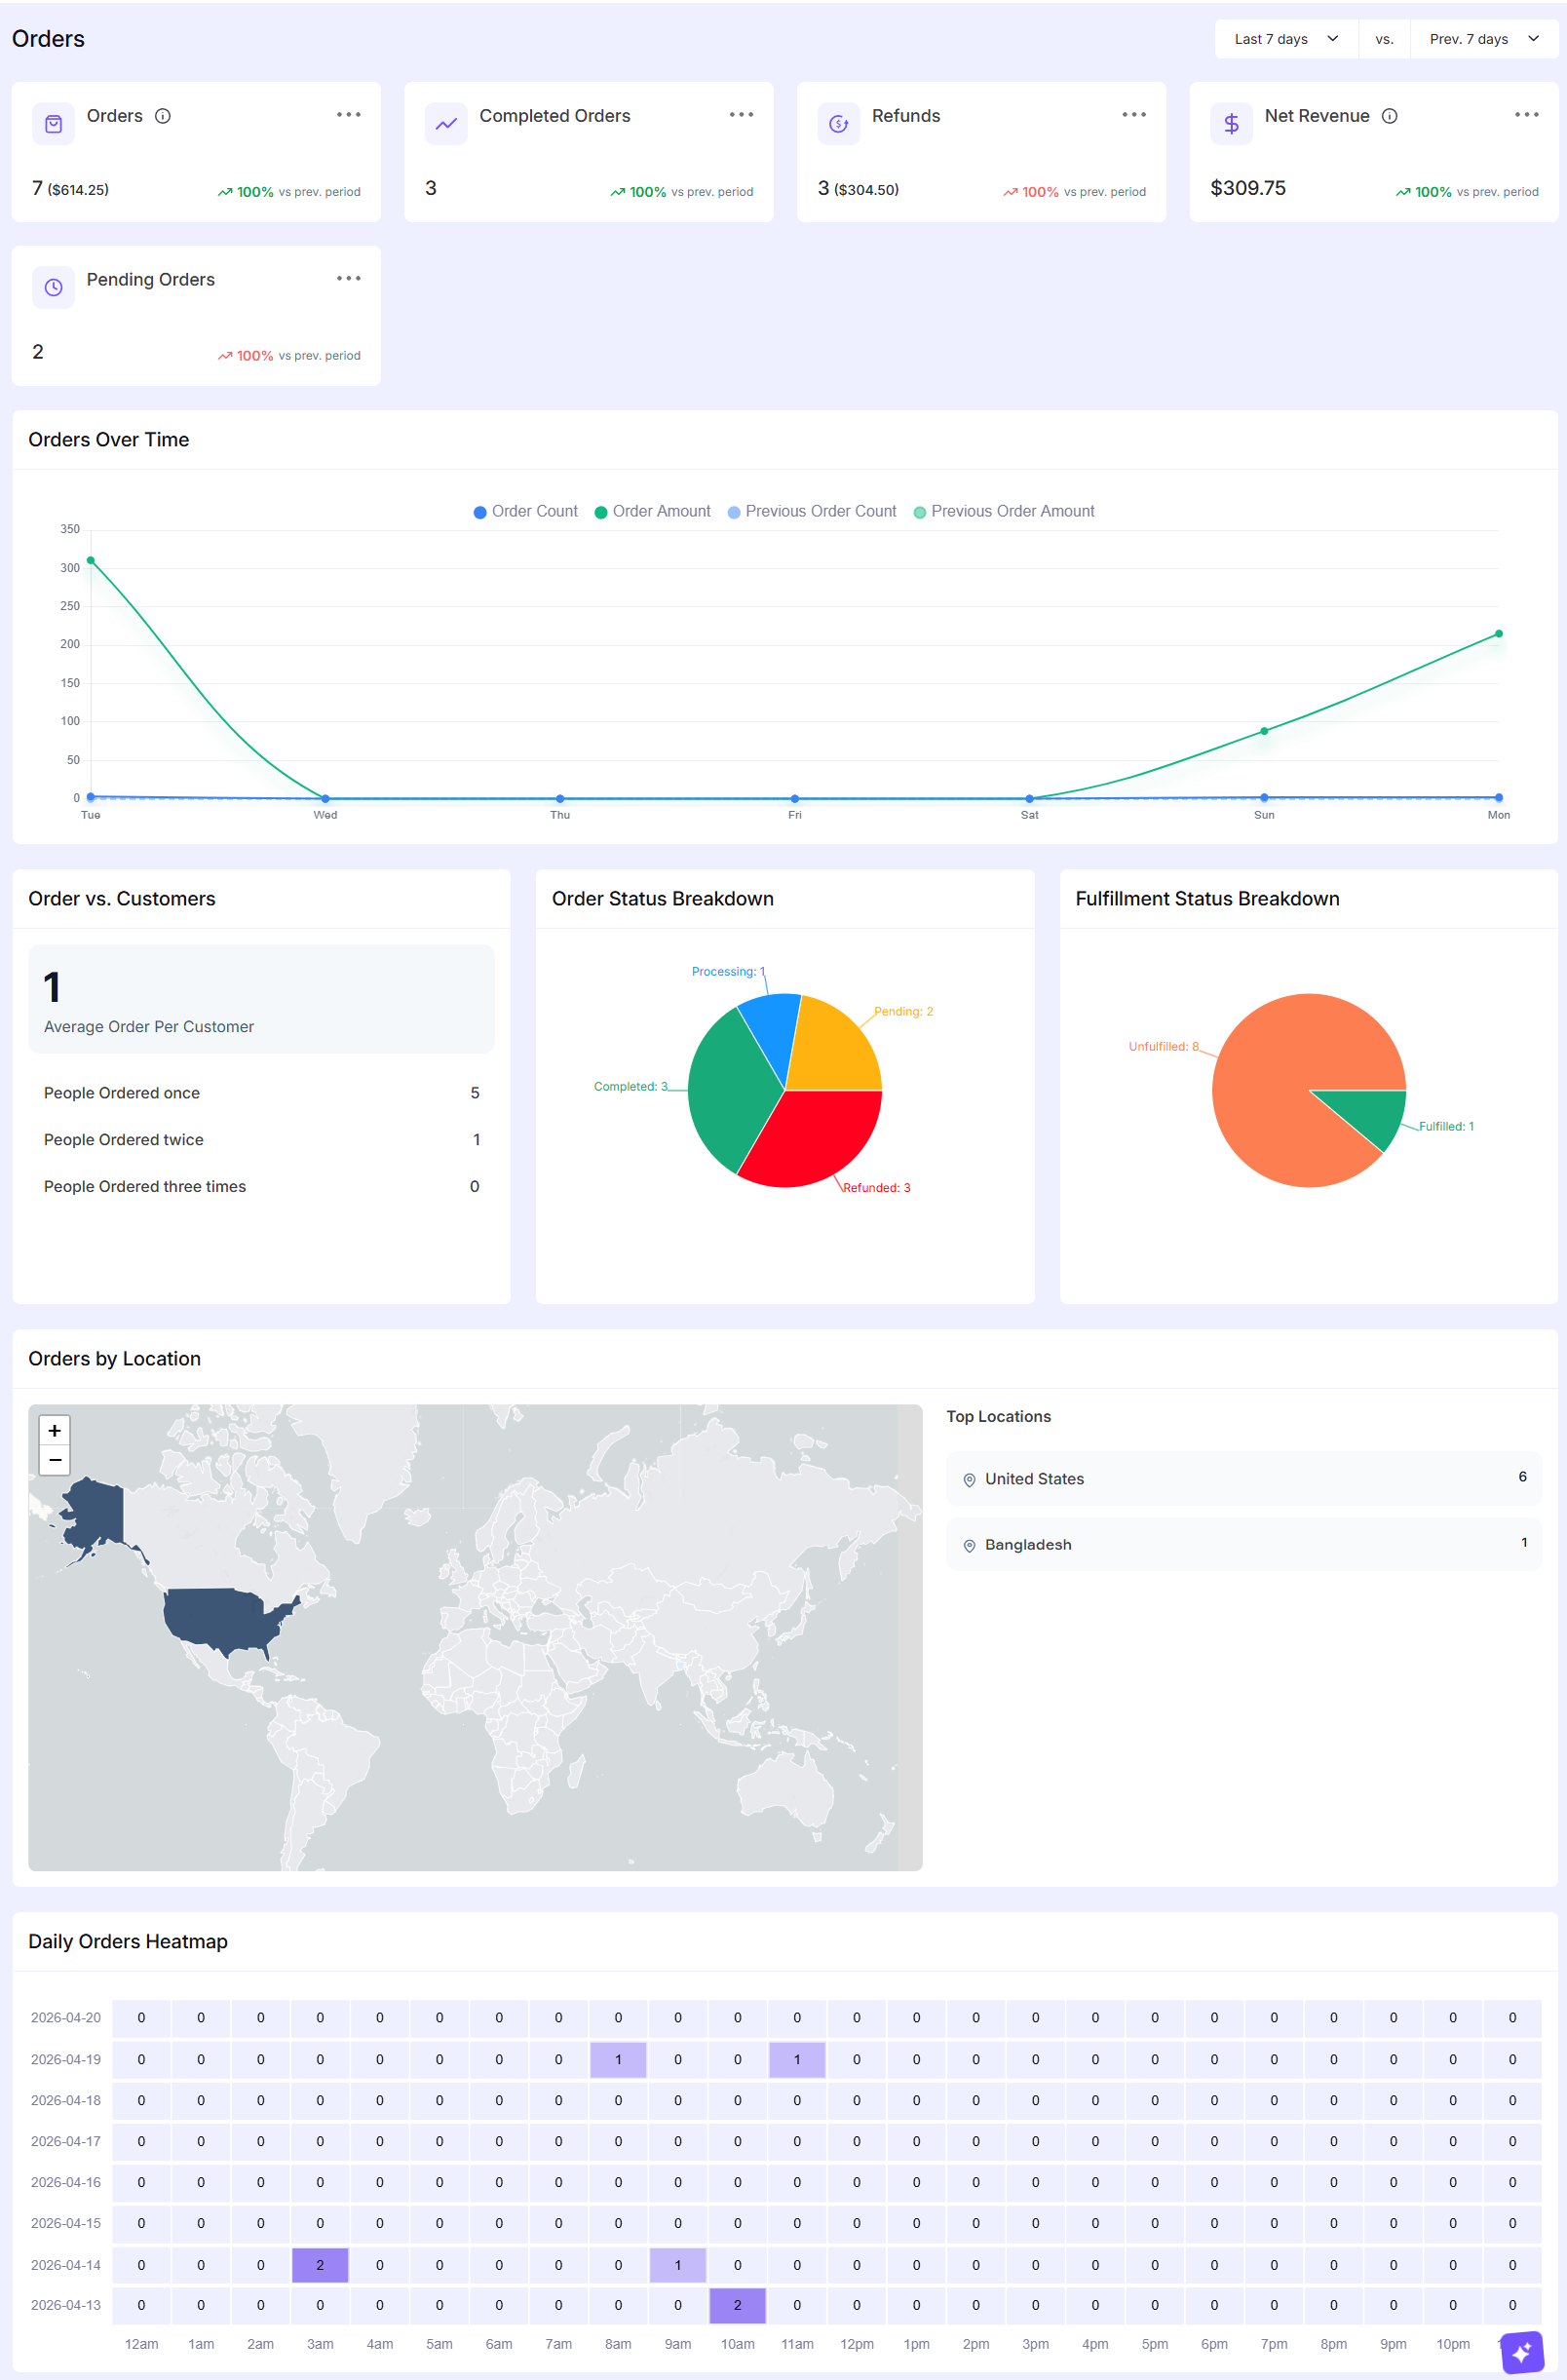
Overview Cards
At the top, you will find a set of summary cards that highlight key metrics:
- Orders – Shows the total number of orders placed within the selected date range along with the total value.
- Completed Orders – Counts how many orders have been successfully completed.
- Refunds – Displays the number of refunded orders and the total refunded amount.
- Net Revenue – Your actual earnings after refunds are deducted.
- Pending Orders – Orders that are yet to be processed or completed.
Each card also compares the current period with the previous one helping you quickly spot growth or decline.
Orders Over Time
This chart shows how your orders and revenue change over time. You can see:
- Order count trends
- Order amount trends
- Comparison with the previous period
It is useful for identifying spikes, slow days or patterns in customer activity.
Order vs. Customers
This section gives a simple breakdown of customer behavior:
- Average orders per customer
- How many customers ordered once, twice or more
It helps you understand repeat purchasing habits and customer loyalty.
Order Status Breakdown
A visual pie chart that shows how orders are distributed across different statuses (e.g. completed, pending, canceled etc.). This makes it easier to see if too many orders are getting stuck in a particular stage.
Fulfillment Status Breakdown
This pie chart focuses on fulfillment:
- How many orders are fulfilled
- How many are still pending
It is helpful for tracking operational efficiency and ensuring orders are being processed on time.
Orders by Location
This section displays where your orders are coming from:
- A world map highlighting order distribution
- A list of top locations with order counts
You can quickly identify your main markets and see where your customers are located.
Daily Orders Heatmap
The heatmap provides a detailed view of order activity by date and time:
- Each row represents a day
- Each column represents an hour
- Darker cells indicate higher order activity
This is especially useful for spotting peak sales hours and planning promotions or staffing accordingly.
Overall the Orders Reports section is designed to give you a quick but meaningful understanding of your store’s performance helping you make better decisions without overcomplicating things.
Was this doc helpful?