


The Overview section inside Reports gives you a quick snapshot of how your store is doing. It is the first place you will want to check to understand sales performance, customer activity and overall business health without digging into detailed reports.
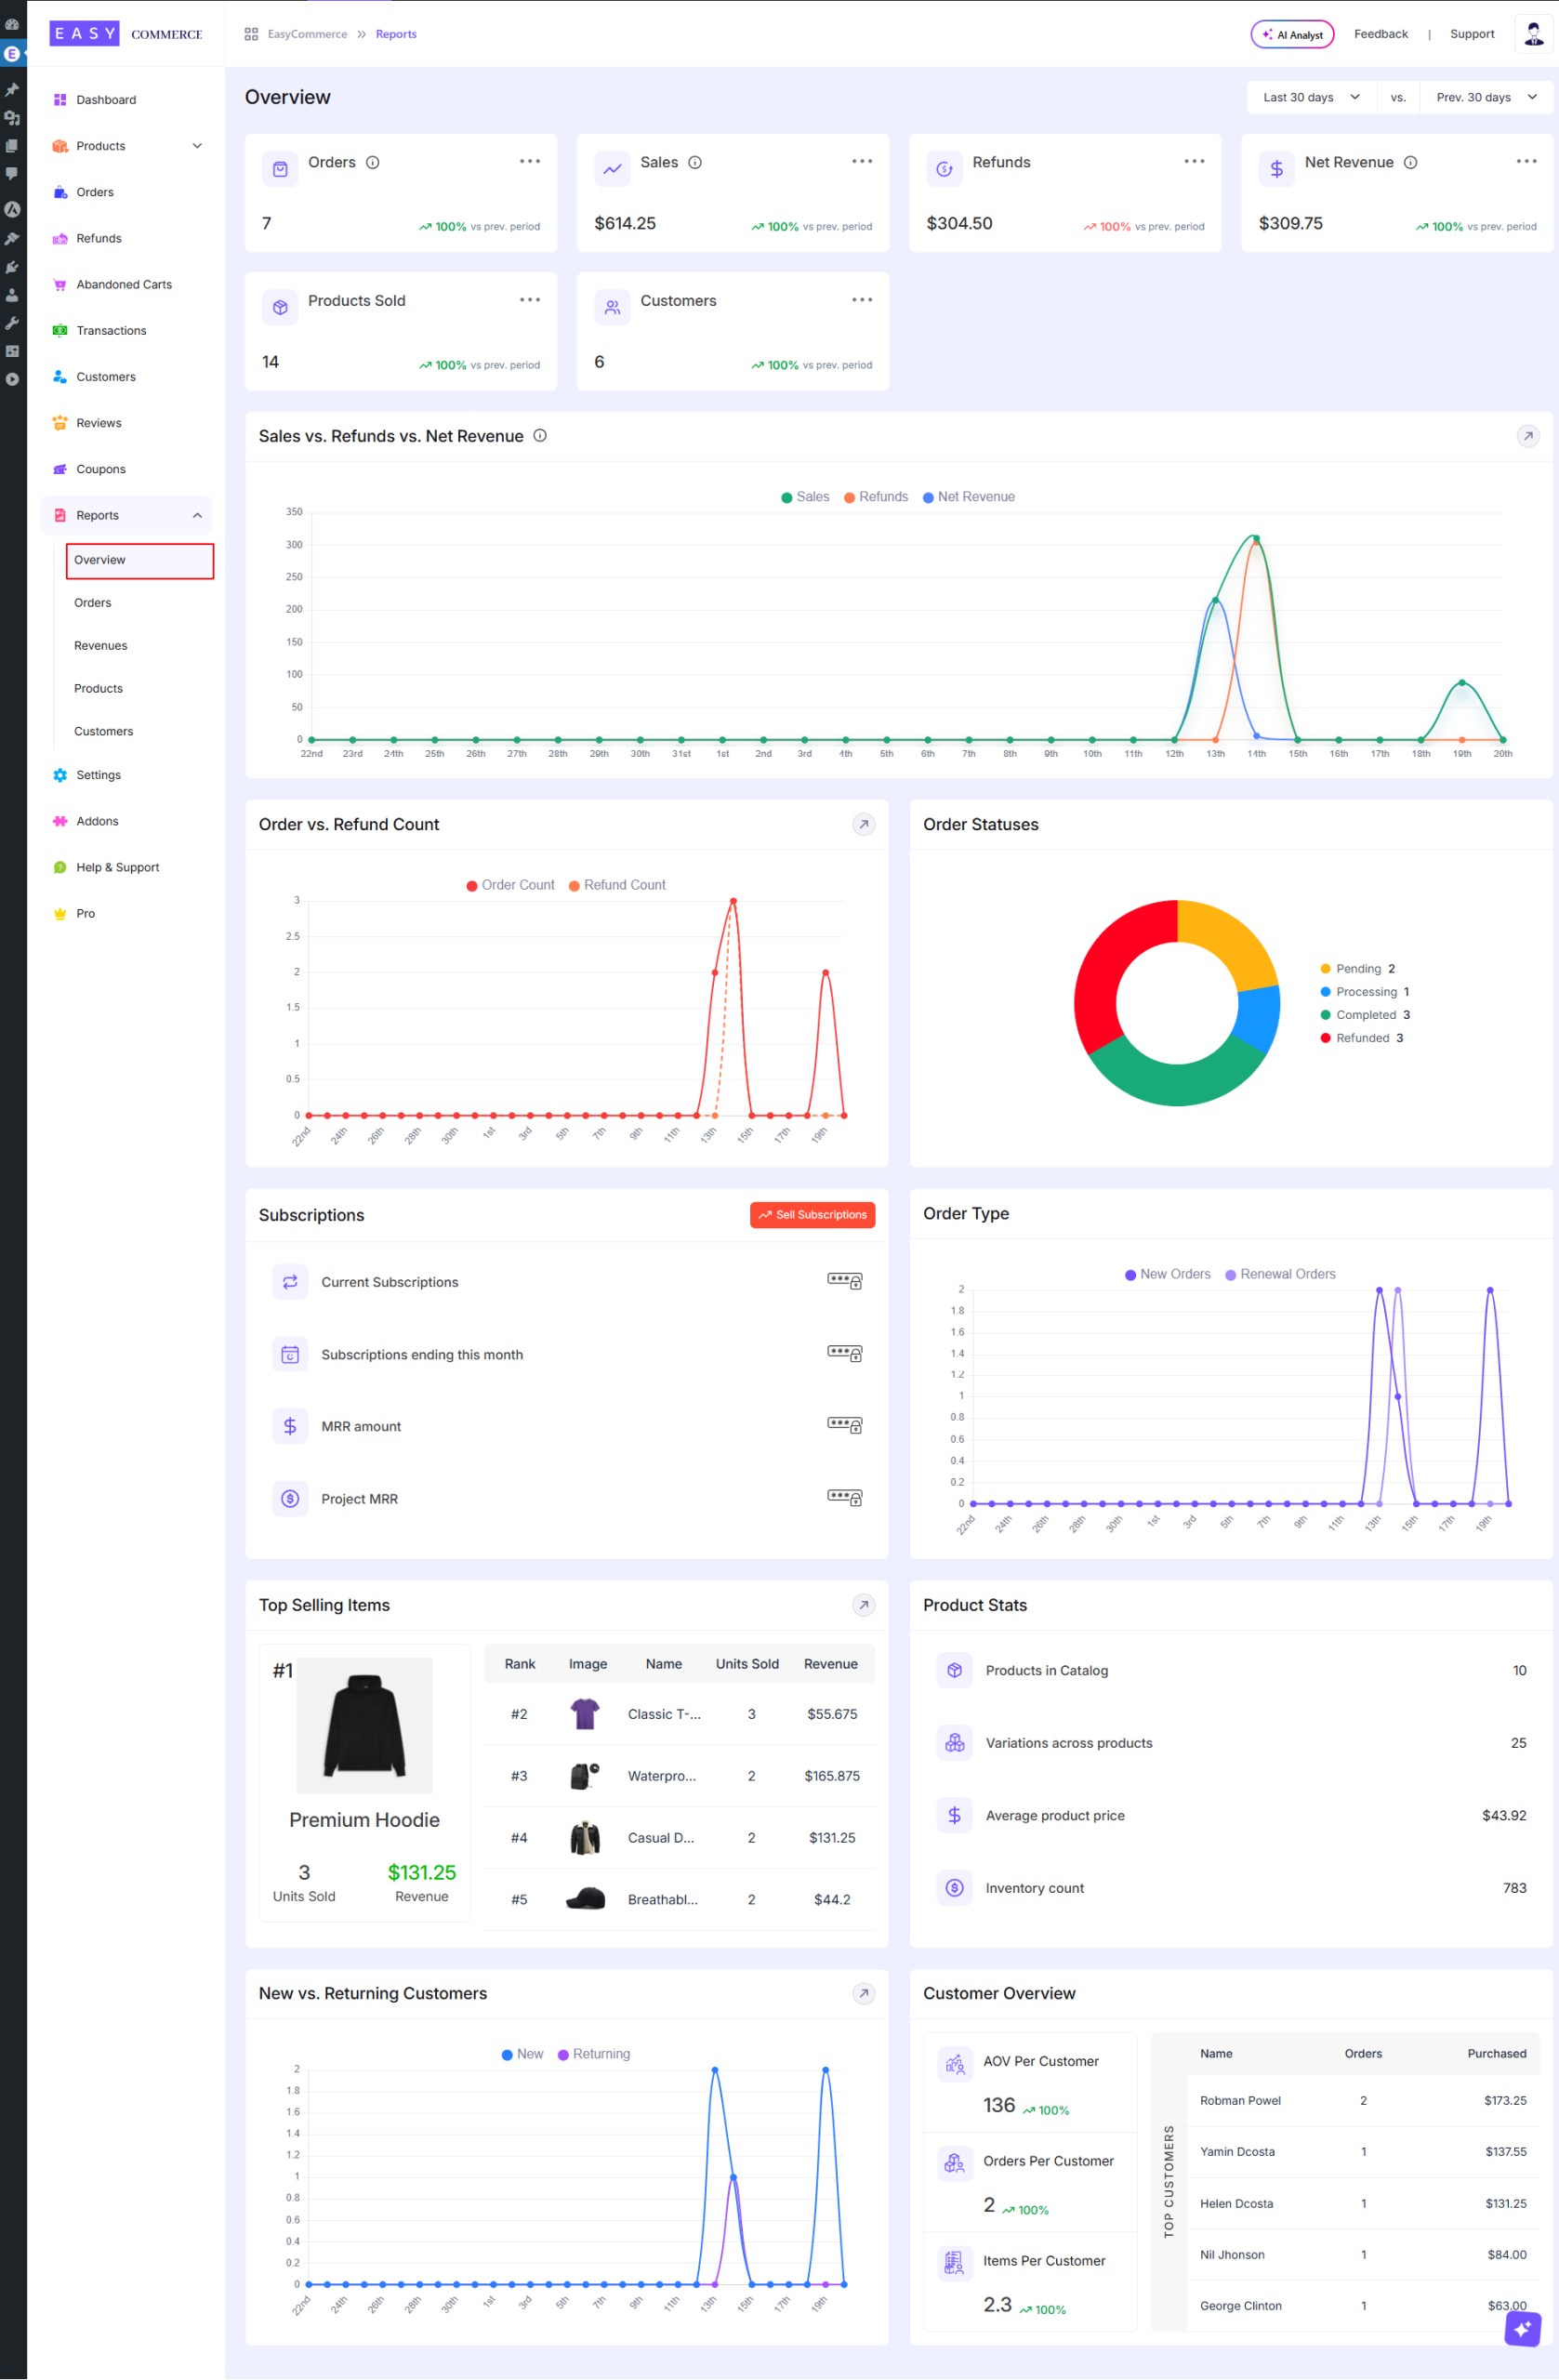
Accessing Reports Overview
Navigate to WordPress Dashboard → EasyCommerce Dashboard → Reports → Overview. This will open the Reports Overview page where you can see a complete summary of your store’s performance including sales, orders, revenue, customers and other key insights in one place
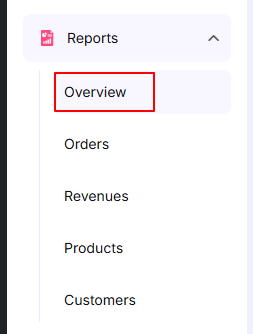
Top Summary Cards
At the top you will see a few key numbers:
- Orders – Total number of orders placed in the selected time range
- Sales – Total sales amount before refunds
- Refunds – Total refunded amount
- Net Revenue – What you actually earned after refunds
- Products Sold – Total quantity of items sold
- Customers – Number of unique customers
Each card also shows a comparison with the previous period, so you can quickly tell if things are improving or dropping.
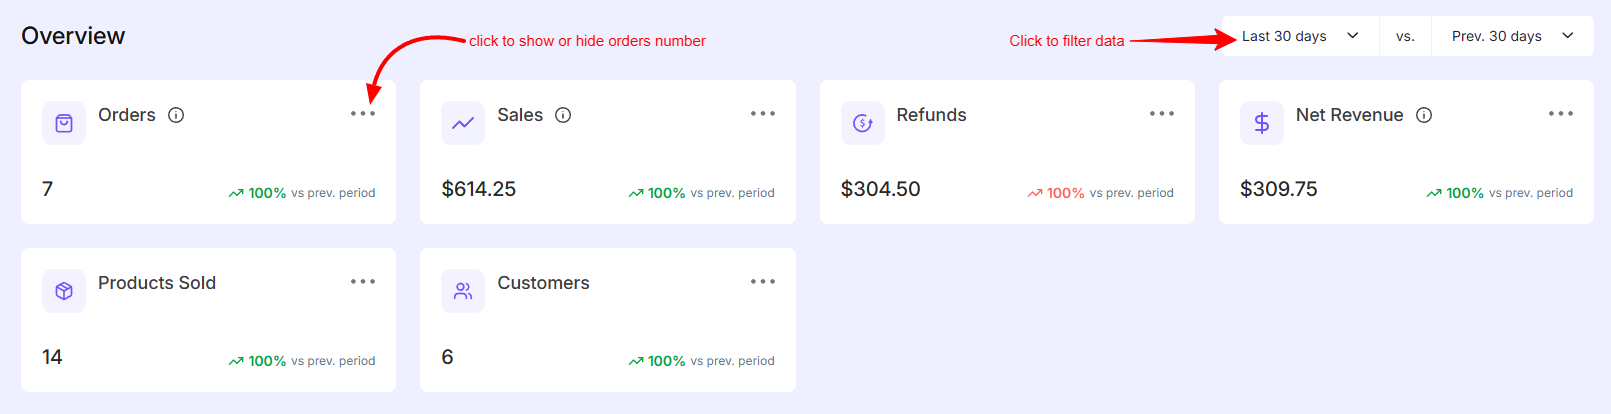
Sales vs Refunds vs Net Revenue
This graph shows how your sales, refunds and net revenue change over time.
- Helps you spot spikes in sales
- Makes refund trends visible
- Good for understanding daily or periodic performance
Click to know more about revenues details.
Order vs Refund Count
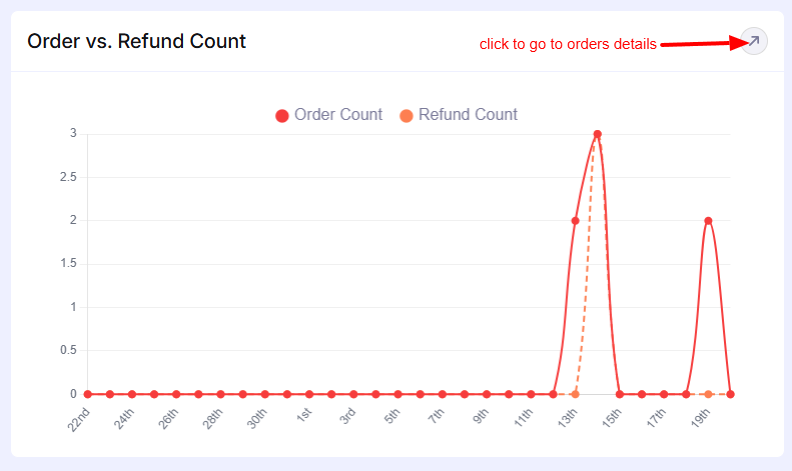
A simple chart comparing:
- Number of orders
- Number of refunds
Useful to quickly check if refunds are unusually high during a certain period.
View detailed order reports details information
Order Status
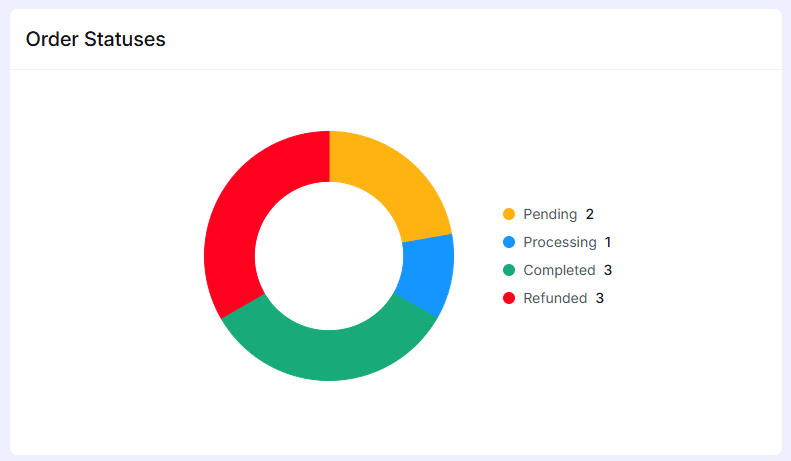
A visual breakdown donut chart of order statuses:
- Pending
- Processing
- Completed
- Refunded
This helps you understand how many orders are still in progress versus completed.
Subscriptions (if enabled)
Shows subscription-related data:
- Current active subscriptions
- Subscriptions ending this month
- Monthly recurring revenue (MRR)
- Projected revenue
There’s also a quick button to manage subscriptions.
Order Type
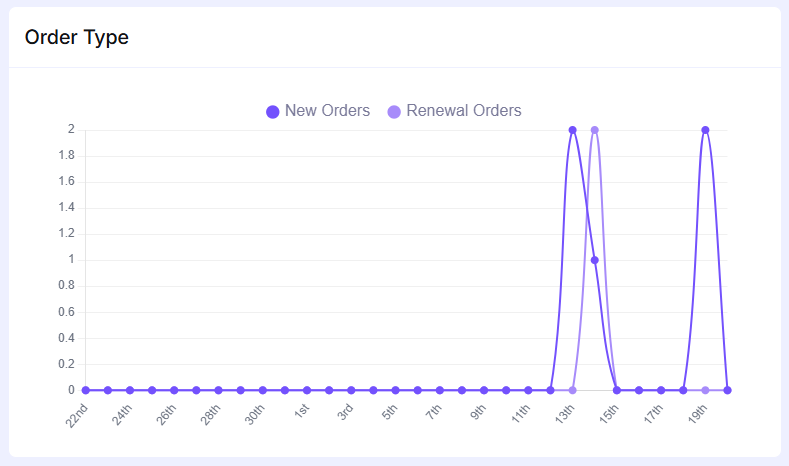
This graph displays the difference between:
- New orders
- Renewal orders
Helpful if you are running subscription-based products.
Top Selling Items
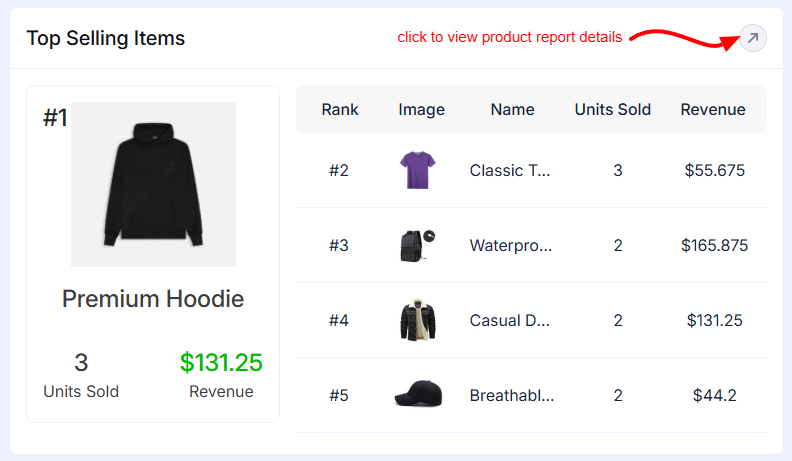
This list shows your best performing products where it includes
- Product name
- Units sold
- Revenue generated
You will also see the top product highlighted separately.
Explore product reports in detail
Product Stats
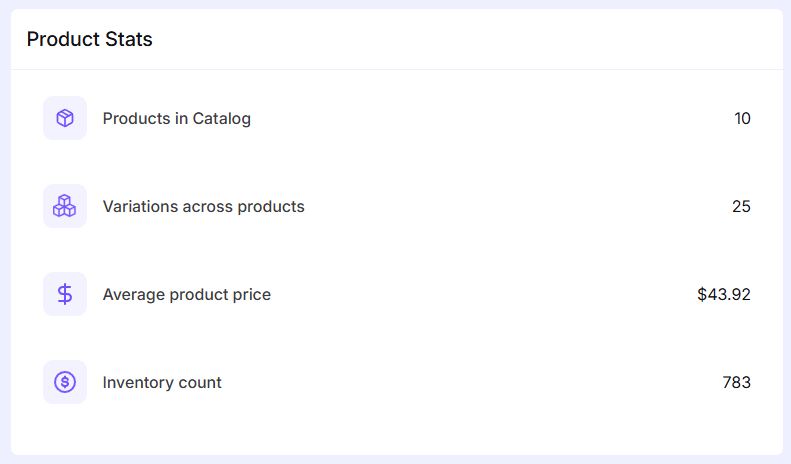
It is a quick stats about your store inventory where it includes
- Total products in catalog
- Product variations
- Average product price
- Inventory count
New vs Returning Customers
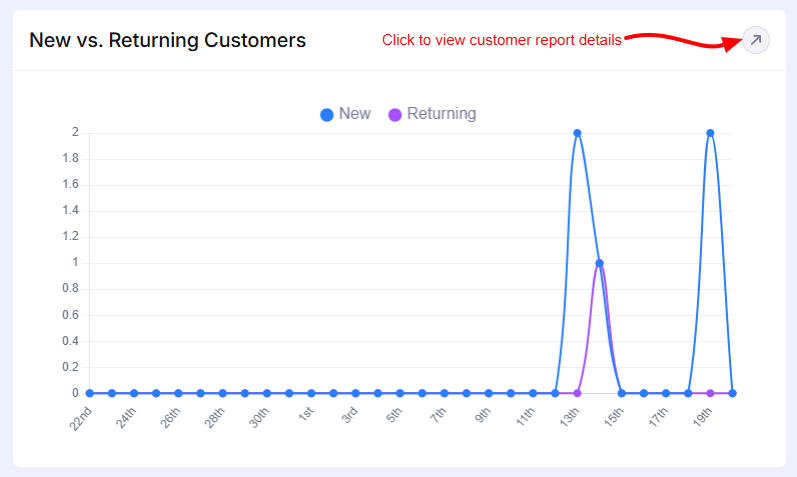
Here graph shows New customers and Returning customers.
Good for understanding customer retention and growth.
See complete customer report details.
Customer Overview
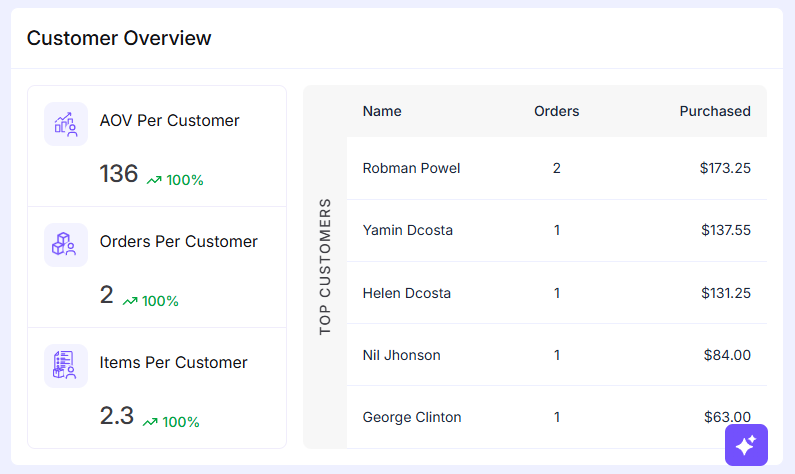
Shows key customer metrics:
- Average order value (AOV)
- Orders per customer
- Items per customer
Also includes a list of top customers based on purchase activity.
The Overview page is meant for quick insights. If you need deeper analysis orders, revenue, customers etc., you can go to the specific report sections from the sidebar.
Was this doc helpful?