


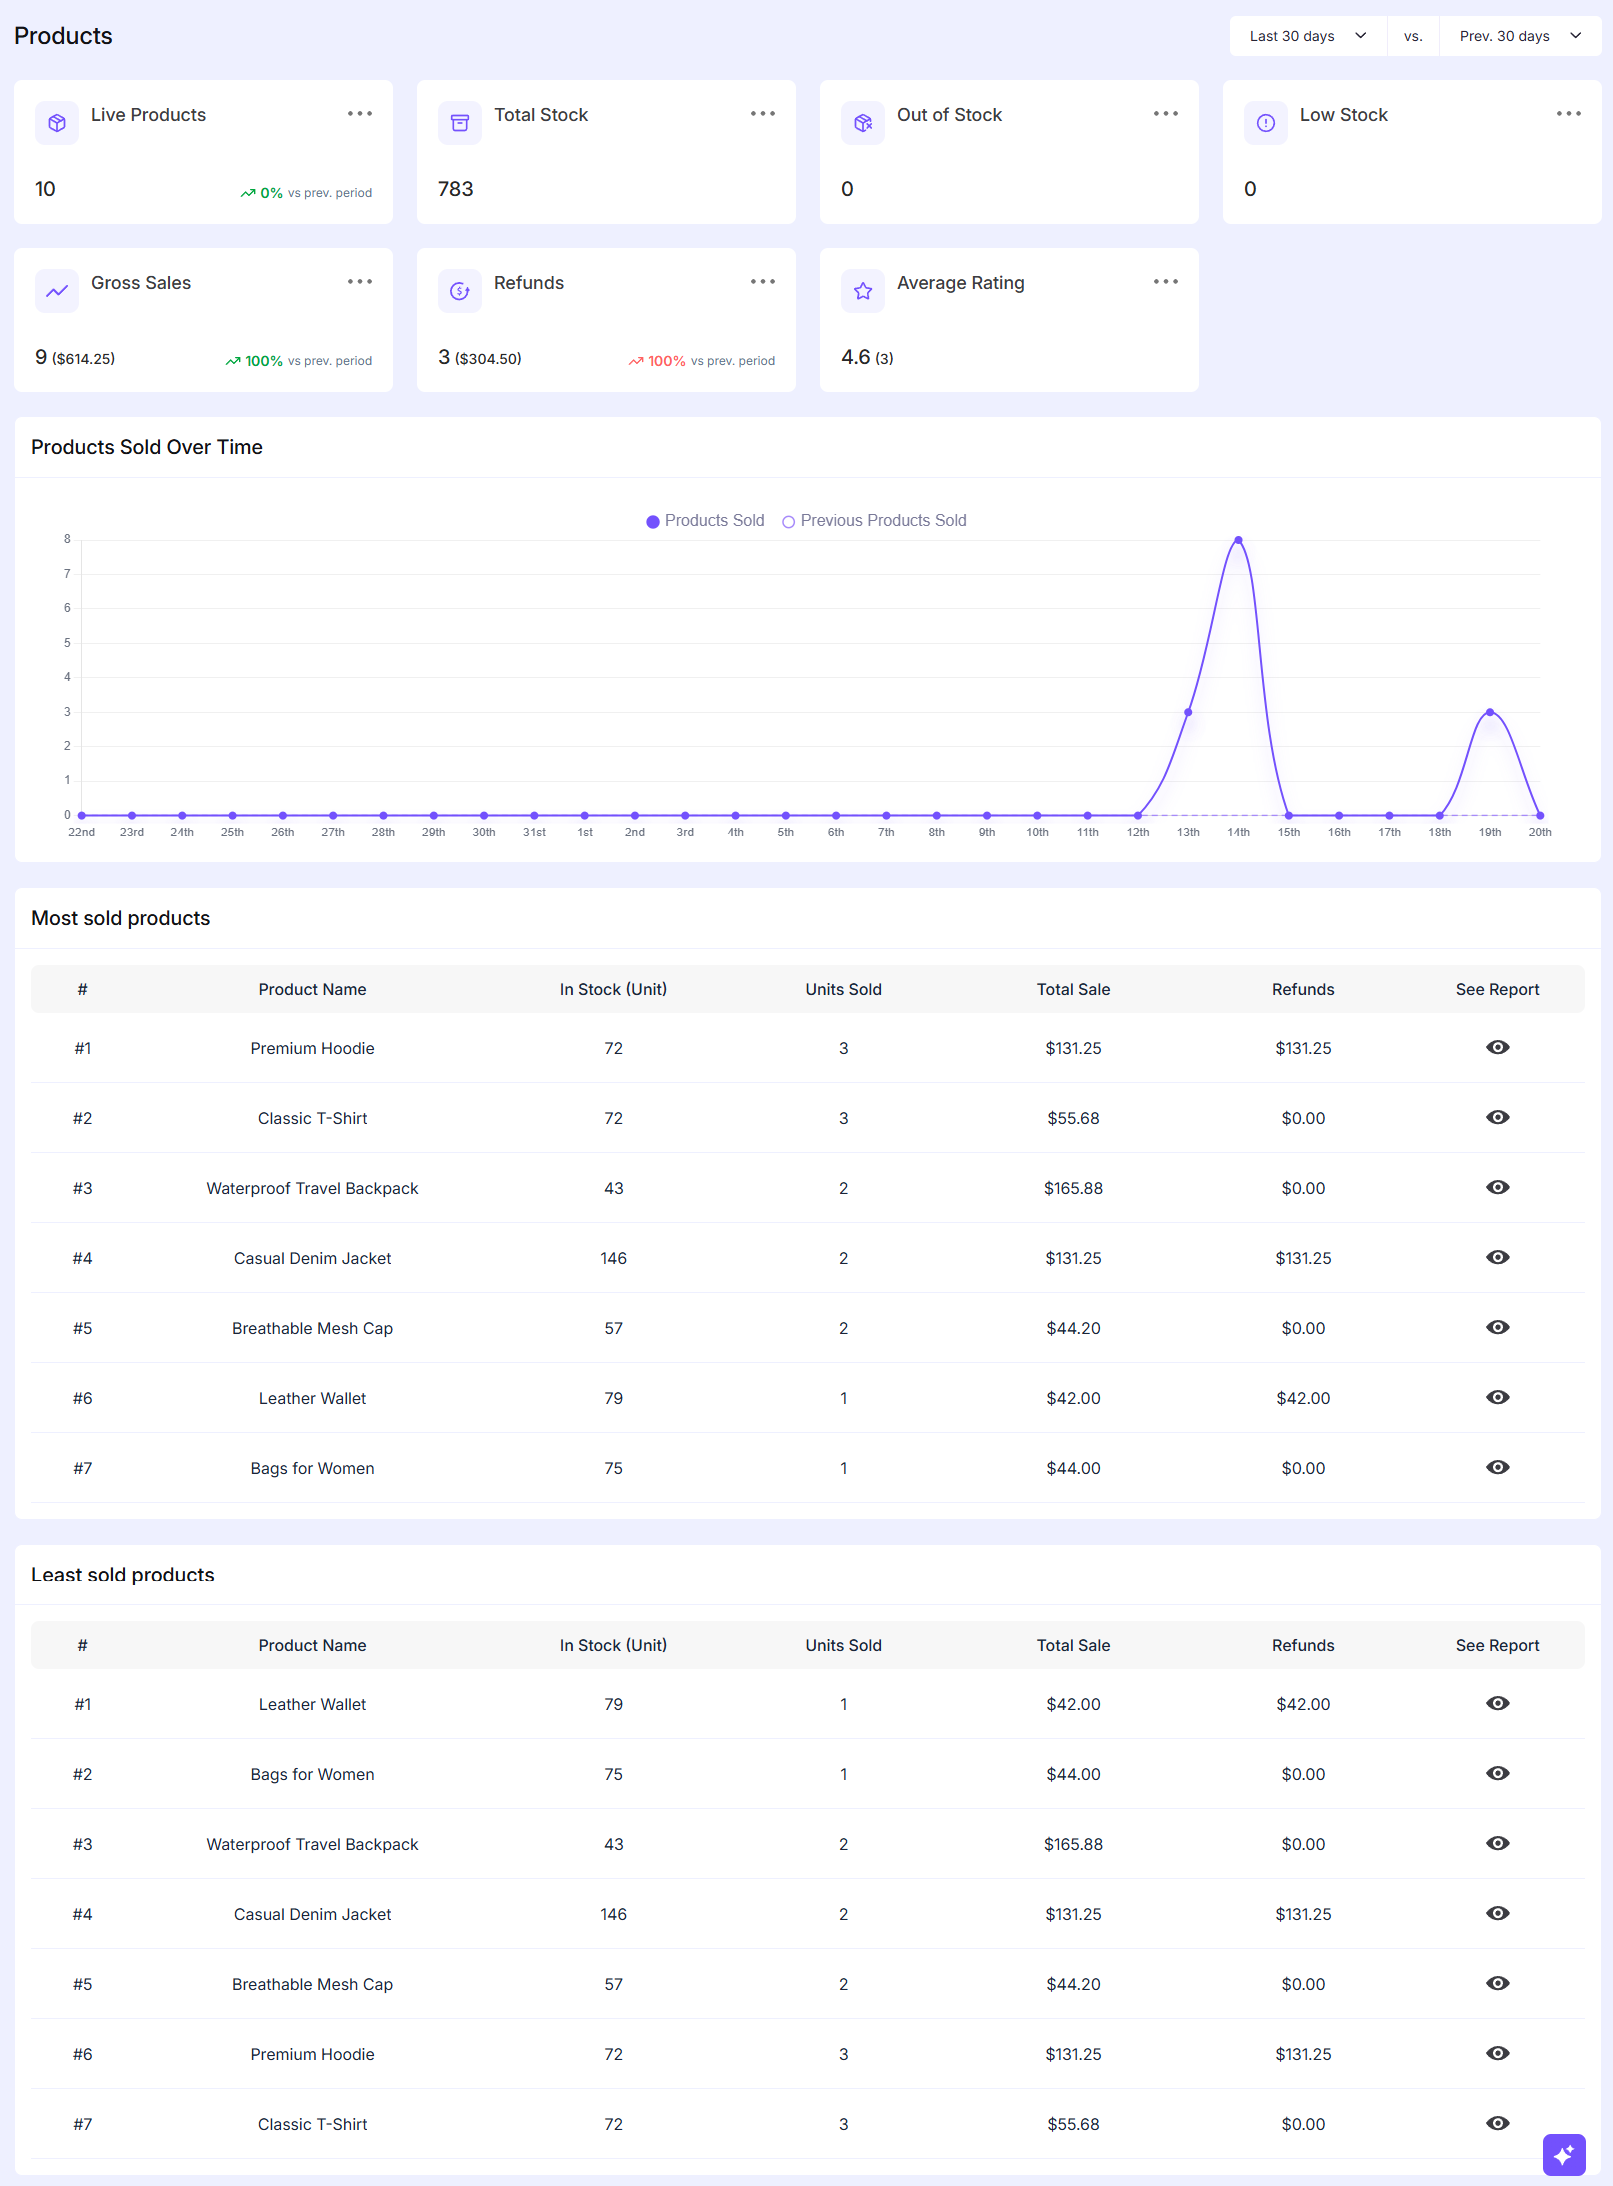
The Products Reports section helps you understand how each product is doing in your store. It shows important details like stock levels and sales activity in a clear and straightforward way so you can easily see performance at a glance.
Accessing Products Reports
To view the Products Reports in EasyCommerce please go to:
WordPress Dashboard → EasyCommerce → Reports → Products
Overview Cards
At the top of the report page you will find several summary cards. These give you a quick snapshot of your store performance:
- Live Products
Shows how many products are currently active and available in your store. - Total Stock
Displays the total number of items available across all products. - Out of Stock
Indicates how many products are completely out of stock. - Low Stock
Helps you identify products that are running low and may need restocking soon. - Gross Sales
Shows the total sales amount generated within the selected time period. - Refunds
Displays the total number of refunded orders along with the refunded amount. - Average Rating
Provides the average customer rating based on product reviews.
Products Sold Over Time
This section shows a graph of product sales over a selected period like last 30 days, last 7 days etc.
- You can compare current sales with previous period sales.
- It helps you notice trends such as:
- Days with high sales
- Sudden drops in performance
- Useful for tracking campaign results or seasonal demand.
Most Sold Products
This table highlights the best-performing products in your store where it includes
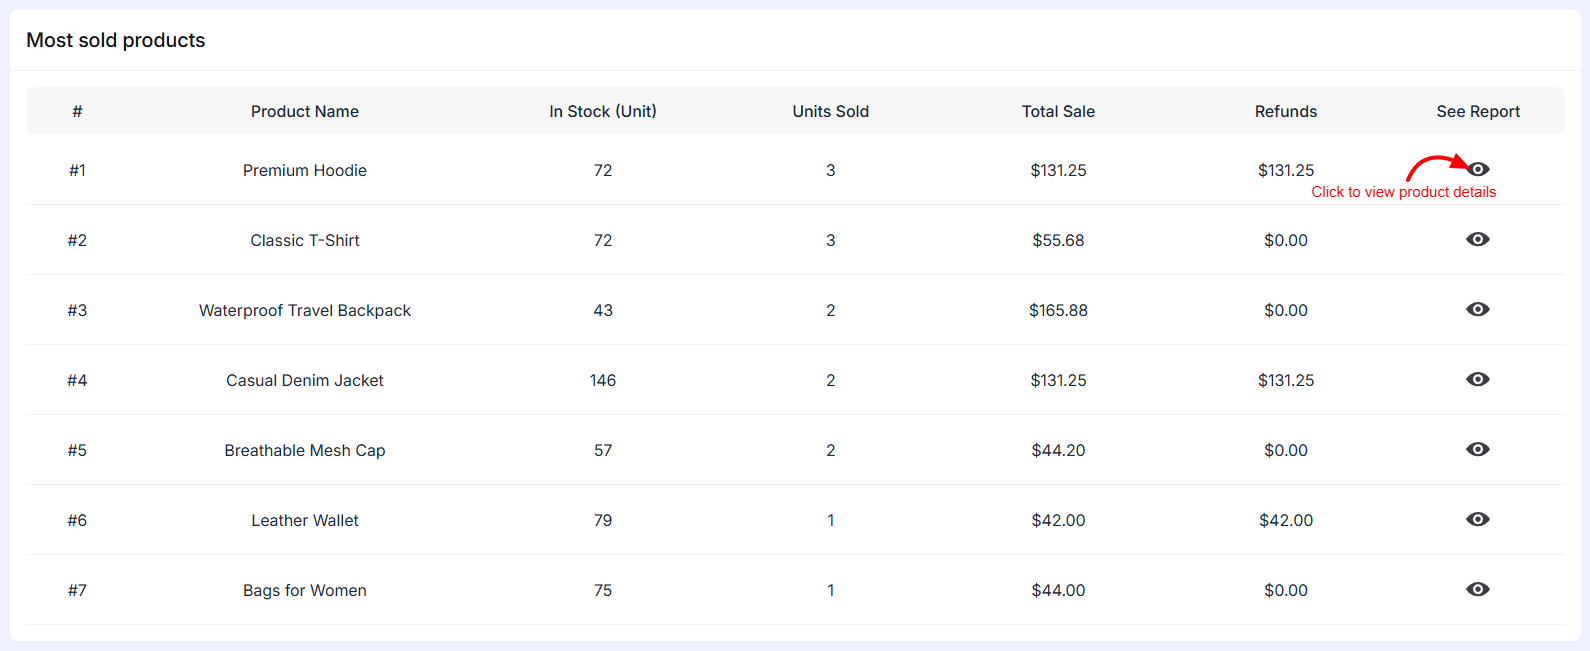
- Product Name – Name of the product
- In Stock (Unit) – Available quantity
- Units Sold – Number of items sold
- Total Sale – Revenue generated from that product
- Refunds – Amount refunded for that product
- See Report – View detailed report for the product
This section helps you understand:
- Which products are selling the most
- Which items generate the highest revenue
Least Sold Products
This section shows products with the lowest performance. Same columns as the Most Sold Products table are included. It helps you:
- Identify slow-moving products
- Decide whether to improve, promote or remove certain items
Was this doc helpful?